Experimental design for data science
Preamble
Overview
INF2178 is a masters-level course at the University of Toronto’s Faculty of Information.
Experimental design has a long and robust tradition within traditional applications such as agriculture, medicine, physics, and chemistry. It allows us to speak of causality with confidence. Typically, these are situations in which control groups can be established, randomization is appropriate, and ethical concerns can be assuaged. Unfortunately, such a set-up is rarely possible in the full extent of the modern applications where we want to understand causality.
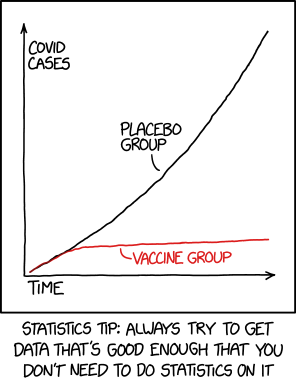
Source: https://xkcd.com/2400/
This course covers the traditional approaches and statistical methods, but focuses on what to do when traditional experimental design methods cannot be implemented or are not appropriate (i.e. what feels like most of the time these days). We cover experiments in their modern guise especially the concerns that we might have when we can run them; but also methods that can provide some causal understanding even when we cannot conduct traditional experiments. Importantly, these approaches do not rely on ‘big data’ or fancy statistics, but instead on thoroughly interrogating the data that are available to get understanding through as simple means as possible.
This is a hands-on course in which you will conduct research projects using real-world data. This means that you will: obtain and clean relevant datasets; develop your own research questions; use the statistical techniques that you are introduced to in class to answer those questions; and finally communicate your results in a meaningful way. This course is designed around approaches that are used extensively in academia, government, and industry. Furthermore, it includes many aspects, such as data cleaning and preparation, that are critical, but rarely taught.
This course is different to many other courses at the University of Toronto. At the end of this course, you will have a portfolio of work that you could show off to a potential employer. You will have developed the skills to work successfully as an applied statistician or data scientist. And you will know how to fill gaps in your knowledge yourself. A lot of scholarships and jobs these days ask for GitHub and blog links etc to show off a portfolio of your work. This is the class that gives you a chance to develop these. It’s very important to having something that shows off what you can do, and that needs to go beyond what is done in a normal class.
How to succeed
In this course you will work in a self-directed, open-ended manner. Identify relevant areas of interest and then learn the skills that you need to explore those areas.
To successfully complete this course, you should expect to spend a large portion of your time reading and writing (both code and text). Deeply engage with the materials. Find a small study group and keep each other motivated and focused. At the start of the week, read the course notes, all compulsory materials and some recommended materials based on your interest. After doing that, but before the ‘lecture’ time you should complete the weekly quiz. During ‘lectures’ I’ll live-code, discuss materials in the course notes, talk about an experiment, and you’ll have a chance to discuss the materials with me.
You need to be more active in your learning in this course than others - read the notes and related materials - and then go out there and teach yourself more and apply it. You will not be spoon-fed in this course. Each week try to write reproducible, understandable, R code surrounded by beautifully crafted text that motivates, backgrounds, explains, discusses and criticizes. Make steady progress toward the assessment.
This is not a ‘bird course’. Typically, after the term is finished, students say that the course is difficult but rewarding. The TAs and I are always available to answer any questions. Please come to office hours!
How we’ll work
This webpage will provide almost all the guiding materials that you need and links to the relevant parts of the notes. The course notes are available here: https://www.tellingstorieswithdata.com. Those contain notes and other material that you could go over. There is a course Slack for discussion. We’ll use Quercus really only for assessment submission and grading. I expect you to work professionally, and so we’ll try to use professional tools to the extent possible.
A rough weekly flow for the course would be something like:
- Read the week’s course notes.
- Read/watch/listen to the compulsory materials.
- Complete the weekly quiz.
- Attend the lecture.
- Attend the lab.
- Make progress on a paper.
Advice from past students
Successful past students have the following advice (completely unedited by me):
- ‘Read the rubrics and treat INF2178 as a storytelling with data course rather than INF1344 part 2. Let the point distribution rubric guide what parts of the paper to focus on/expand. And pay attention to the “telling stories” part of the site URL. The point of the papers isn’t to chuck every statistical method and cool R trick you know in there, it’s to practice building data-driven arguments that different audiences might actually care about. Last, the piece of advice I wish I had followed for the class: keep a log of things that you find confusing/cool/useful.’
- ‘Allocate as much time as you realistically can to projects. It all takes longer than expected (particularly debugging) so be a friend to your future self and don’t leave work to the last minute. Really.’
- ‘Read the paper rubrics very carefully! The papers will always take longer than you think they will so try to start early and put enough time before submitting to make sure you sort out any issues with formatting and knitting your pdf because there will almost always be issues (especially if you’re doing it for the first time). Write the papers with an external audience in mind, not just as a school paper that only Rohan will read. Consider the papers to be personal projects that your peers and potential employers will be reading, and try to write something you feel could be published. Also, comment your code and thank yourself later :)’
- ‘Do the readings even though there are a lot and don’t be afraid to ask questions no matter how stupid you think they are (unless the answer can easily be found, ie “is assignment 1 group or solo”). Also, Rohan is not as intimidating as he initially seems. Also, if you did poorly on assignment 1, don’t drop the class. There’s still so much to learn and the chance of making it up with the other two assignments.’
- ‘You’re going to have to practice solving your own code problems, reviewing and keeping track of detailed assignment requirements, critical thinking about data, and editing your own work. It will take more time than you think.’’
- ‘1) Try to keep up week to week as best as possible; watching the lectures is more rewarding that way because you have some understanding, especially if you watch asynchronously and can’t just ask the professor questions. Sometimes that means even skimming what readings you can if time is tight, otherwise you may feel quite lost. 2) R documentation is your best friend when you don’t wholly understand the examples in the course notes, or you’re looking for other viable solutions. Stack Overflow is also a great help, but don’t forget to cite everything you’ve taken from there so you remember where it came from when wondering, “How does this even work? It works, but how?” 3) Sometimes, your code will infuriate you. Take breaks. Step away for a half hour, do something else entirely for a while, or even come back tomorrow. Don’t beat yourself up too much over it. You can also ask for assistance in the course Slack, because odds are someone else has already encountered this issue and arrived at a solution. 4) Trust Rohan and his process. It’s going to rely on your efforts to learn on your own -and it’s going to feel like a harsh bootcamp- but you’ll learn to make friends with data and coding. 5) Practice the examples on your own before class. 6) Don’t be afraid or intimidated by other’s who seem to know more than you. 7) Attend Toronto Data Workshop whenever you can. 8) Form a study group early on’
- ‘Don’t stop at just the assignment prompt. Have fun with your topic and see how you can take it further’
Acknowledgements
Thanks to the following who helped develop this course: Monica Alexander, Kelly Lyons, Sharla Gelfand, Faria Khandaker, Hidaya Ismail, A Mahfouz, Paul Hodgetts, Thomas Rosenthal.
Past iterations
- 2020
- 2021
Content
Each week you should go through the course notes and all compulsory materials. During the lecture I will live-code various aspects. I will also discuss a case study, typically a paper. During the lab, a TA will either lead small group discussions or similarly lead other work. The lecture will be recorded and posted here, but again, it’s not enough to just watch that - you need to read and write yourself.
Week 1
‘Drinking from a fire hose’.
- Content: Drinking from a fire hose, R Essentials.
- Case Study: Fisher’s Lady Tasting Tea.
- Lab: Go through first four modules of DoSS Toolkit and discuss any issues with the TA.
Week 2
‘Science-ing’.
- Content: Workflow, Static communication.
- Case Study: Tuskegee Syphilis Study.
- Lab: Go through modules five to eight of DoSS Toolkit and discuss any issues with the TA.
Week 3
‘Why, if ever I did fall off—which there’s no chance of—but if I did–’.
- Content: Experiments, and treatment effects.
- Case Study: The Oregon Health Insurance Experiment in the United States.
- Special guest: Greg Wilson on how to run a meeting.
- Lab:
- Please pretend that you work as a junior analyst for a large consulting firm. Further, pretend that your consulting firm has taken a contract to put together a facial recognition model for the Canada Border Services Agency’s Inland Enforcement branch. Write five or six points with regard to your thoughts on this matter. What would you do and why? Then split into small groups and compare your points with others. Do you think the model would end up being implemented?
- With the help of the TA, please conduct ‘face-to-face’ surveys (via Zoom). For this exercise, you will be randomly split into groups of two. You have two minutes in each group and will then be swapped to another group. One person is to survey the other person asking the following questions: i) ‘What is your gender?’, ii) ‘What is your age?’, iii) ‘What is your marital status?’, iv) ‘What is your income?’, v) ‘If an election were held today who would you vote for?’. After one person is done, then switch roles. When you are the questioner you should record all responses using a small CSV (but not the person’s name please). When you are the respondent you are welcome to not respond. You will cycle through this multiple times. At the end, please write a small reflection about: 1) as a respondent, how you felt answering these questions and the implications that you think this feeling may have for how survey questions are answered more generally; and 2) as a questioner, how difficult it was to code responses and the implications this may have for the dataset that we analyse.
Week 4
‘Gathering data’.
- Content: Gathering data.
- Case Study: Student Coaching: How Far Can Technology Go?
- Lab:
- Please pretend you work for Netflix and you want to know more about why people subscribe (or don’t!) when prices change. Please design an experiment, discuss its key features and how you would implement it. Please pay special attention to sampling issues. Then simulate an outcome.
- Following the guidance of the TA, please scrape some data and discuss some ethical considerations around the dataset that you created. You may like to write a short blog post discussing the difference between data being public but scattered, and a consolidated dataset being public with reference to Kirkegaard and Bjerrekær, 2016, and Politou, Alepis, and Patsakis, 2018 (if you do that please do email a link to me out of interest).
Week 5
‘Whoops, I forgot EDA’.
- Content: Exploratory Data Analysis.
- Case Study: Civic honesty around the globe
- Lab:
- Pretend that you work for Loblaws as a data scientist and it is late March 2020. As part of normal monitoring, you have noticed that purchases of flour and pasta have increased substantially. You had been planning to increase the price of these items in April as part of a trial, but now your manager is not sure whether it is appropriate to conduct the trial. Please write five or six points with regard to your thoughts on this matter. What would you do and why?
- Analyse the Toronto AirBNB dataset with guidance from the TA.
Week 6
‘IJALM - It’s Just A Linear Model’.
- Content: Linear and logistic regression and
tidymodels - Case Study: Upworthy A/B tests of headlines.
- Special guest: Kathy Ge on experiments at Uber.
- Lab recording:
- Following the guidance of the TA, please use Blogdown to create a simple website and then design and execute a simple A/B test for your website using Netlify.
Week 7
‘Celestial Navigation’.
- Content: Simulation, power, RCTs, A/B testing.
- Case Study: Please pick one chapter from Catherine D’Ignazio and Lauren F. Klein, Data Feminism, that is of interest to you and read it (freely available: https://data-feminism.mitpress.mit.edu).
- Lab:
- Following the guidance of the TA, please make a Shiny app that bundles a little data and some code and post it to shinyapps.com.
Week 8
‘Such a shame they’ll never meet’.
- Content: Matching and difference in differences.
- Case Study: Funding of Clinical Trials and Reported Drug Efficacy
- Special guest: Emily Riederer on observational causal inference.
- Special guest: Tamar Oostrom on funding of clinical trials.
- Lab:
- Following the guidance of the TA, please look at McClelland, Alexander, 2019, ‘“Lock This Whore Up”: Legal Violence and Flows of Information Precipitating Personal Violence against People Criminalised for HIV-Related Crimes in Canada’, European Journal of Risk Regulation, 10 (1), pp. 132-147.
- Then look at Policing the Pandemic - https://www.policingthepandemic.ca/. Look into how they gathered their dataset and what it took to put this together. What is in the dataset and why? What is missing and why? How could this affect the results? How might similar biases enter into other datasets that you have used or read about?
- Put together a brief model. You may like to write a short blog post about the biases and influences that are in this dataset (if you do that please do email a link to me out of interest).
Week 9
‘Why does it always rain on me?’.
- Content: Regression discontinuity and instrumental variables.
- Case Study:
- Lab:
- Following the guidance of the TA, please make an R package that bundles a little data and some code and add it to your GitHub. Don’t forget to include at least one test.
Week 10
‘Post Hoc, Ergo Propter Hoc’.
- Content: DAGs, bias, and paradoxes.
- Case Study: Joshua Kalla and David Broockman, 2016, ‘Campaign Contributions Facilitate Access to Congressional Officials: A Randomized Field Experiment’
- Lab:
- Following the guidance of the TA, please look back on the case studies that we’ve covered so far. Please break up into small groups and create DAGs for each. Then write some notes about the potential for confounding, selection bias and measurement bias. Pick one person in your group to make a brief 2-minute presentation about what you did.
Week 11
‘But it works on my machine’.
- Content: Shiny, cloud, and deploying.
- Case Study: Alexander, M., Wildeman, C., Roehrkasse, A., and Rudlang-Perman, K., 2020, ‘Forecasting child welfare outcomes in the United States’, Shiny app; Technical model summary.
- Lab:
- Following the guidance of the TA, and thinking about what we covered in lectures, please read, compare, and discuss:
- Bendavid, E., Mulaney, B., Sood, N., Shah, S., Ling, E., Bromley-Dulfano, R., …, and Tversky, D, 2020, ‘COVID-19 Antibody Seroprevalence in Santa Clara County, California’, MedRxiv, https://www.medrxiv.org/content/10.1101/2020.04.14.20062463v1.full.pdf.
- Gelman, Andrew, 2020, ‘Concerns with that Stanford study of coronavirus prevalence’, Statistical Modeling, Causal Inference, and Social Science, 19 April, https://statmodeling.stat.columbia.edu/2020/04/19/fatal-flaws-in-stanford-study-of-coronavirus-prevalence/.
- Eisen, Michael B., and Robert Tibshirani, 2020, ‘How to Identify Flawed Research Before It Becomes Dangerous’, New York Times, 20 July, https://www.nytimes.com/2020/07/20/opinion/coronavirus-preprints.html.
- Gelman, Andrew and Bob Carpenter, 2020, ‘Bayesian analysis of tests with unknown specificity and sensitivity’, 8 July, http://www.stat.columbia.edu/~gelman/research/published/specificity.pdf.
- Following the guidance of the TA, and thinking about what we covered in lectures, please read, compare, and discuss:
Week 12
‘Lorem ipsum’.
- Content: Text-as-data.
- Case Study: Kevin Munger, Patrick Egan, Jonathan Nagler, Jonathan Ronen, and Joshua A. Tucker, 2017, ‘Political Knowledge and Misinformation in the Era of Social Media: Evidence From the 2015 UK Election’.
- Lab:
- Please form small groups and discuss, ‘to what extent do quantitative methods merely project forward the past, and what implications does this have for our conduct as practitioners and consumers?’
Assessment
Summary
| Item | Weight (%) | Due date |
|---|---|---|
| Weekly quiz | 20 | Weekly before the lecture |
| Professional conduct | 1 | Anytime during the teaching term |
| Paper 1 | 25 | End of Week 3 |
| Paper 2 | 25 | End of Week 6 |
| Paper 3 | 25 | End of Week 9 |
| Final Paper (initial submission) | 1 | End of Week 12 |
| Final Paper (peer review) | 3 | Three days after that |
| Final Paper | 25 | Ten days after that |
Weekly quizzes
- Due date: Weekly before the lecture.
- Weight: 20 per cent (no quiz in Week 1 or Week 12 and only best eight out of ten count.)
- Task: Please complete a weekly quiz in Quercus.
- Questions: The questions that form the quiz are drawn from those in the course notes.
Professional conduct
- Due date: Anytime during the teaching term.
- Weight: 1 per cent
- Task: We (optionally) use Slack to interact in this class. At some point during the teaching term, please use Slack to answer another student’s question or otherwise similarly be generally helpful in a professional manner. When you do that, please share the comment into the ‘Professional conduct’ channel and @ me (hover on the message, click share message, type in the channel ‘profession_conduct’, add a message that @‘s me, and click ’share’). You’ll get the full mark just for one helpful interaction. (If you are opting out of using Slack - which is entirely fine - then instead, at some point in the term send me an email with a link that is relevant to the course materials and that I should add to the course notes. Please be clear that this is your ‘professional conduct’ submission by stating that in the subject line.)
Paper #1
- Due date: End of Week 3.
- Weight: 25 per cent (for Papers #1-#3 the best two of three count).
- Task: ‘Mandatory minimums’
Paper #2
- Due date: End of Week 6.
- Weight: 25 per cent (for Papers #1-#3 the best two of three counts).
- Task: ‘These numbers mean dial it up’
Paper #3
- Due date: End of Week 9.
- Weight: 25 per cent (for Papers #1-#3 the best two of three counts).
- Task: ‘The Short List’.
Final Paper
- Due dates:
- Initial submission: End of Week 12.
- Peer review: Three days after that.
- Final Paper: Ten days after that.
- Weight: 29 per cent (4 per cent of this is for initial submission and peer review conducted a week before).
- Initial submission: 1 per cent
- Peer review: 3 per cent
- Final Paper: 25 per cent
- Task: ‘Two Cathedrals’