On the privilege of turning our world into data
A talk at the ‘Young Irish Statisticians’ group.
The slides are here.
Introduction
Hi, my name is Rohan Alexander. I’m an assistant professor at the University of Toronto in the Faculty of Information and the Department of Statistical Sciences. I’m also one of the co-leads of the University of Toronto Data Sciences Institute Thematic Program in Reproducibility. We’d love to develop ties with other institutions who are similarly interested in these issues, so please do get in touch.
I’d like to thank Niamh Cahill for the opportunity to talk today. I always feel a little awed by everything that she’s able to accomplish and all her publications. In preparing for this talk I was looking for imminent historical Irish statisticians, and of course arguably one of the most imminent present-day Irish statisticians is Adrian Raftery, who had a PhD student, Leontine Alkema, who was Niamh’s postdoc advisor. And Niamh certainly lives up to her pedigree.
I must admit that I feel a bit of a fraud talking today at this Young Irish Statisticians group. I’m no longer young, I’m certainly not Irish, and I’m not a statistician. But I do adore your country, and I spend a lot of time with statisticians, and I was once young. That said, I do hope that in a few years you can invite me back and we can do this in person, perhaps at the middle-aged Irish-fans pseudo-statisticians’ group!
Today I’d like to talk a little about the origins of data science, especially mentioning the contributions of some Irish statisticians. I will turn to what I see data science as, and what I see are some of our roles and responsibilities as quantitatively interested folks. I will then go through various applications including: understanding the effect of elections; hate speech detection; and the reproducibility of COVID-19 pre-prints. While going through those applications I will focus more on what I learned and how I developed, rather than specific results. I will close with a few open issues.
None of what I’m about to say is cannon, this talk is more my way of trying to work out what I think, so I’d appreciate your reactions and comments.
What is data science?
When we think about data science, I think that we all have different things in mind.
The only thing that is certain, is that there is no agreed definition of data science, but a lot of people have tried. For instance, Wickham and Grolemund (2016) say it is ‘…an exciting discipline that allows you to turn raw data into understanding, insight, and knowledge.’ Similarly, Leek and Peng (2020) say it is ‘…the process of formulating a quantitative question that can be answered with data, collecting and cleaning the data, analyzing the data, and communicating the answer to the question to a relevant audience.’ Benjamin S. Baumer and Horton (2021) say it is ‘…the science of extracting meaningful information from data.’ And Timbers, Campbell, and Lee (2021) say they define ‘data science as the process of generating insight from data through reproducible and auditable processes’.
Craiu (2019) argues that the lack of certainty as to what data science is, might not matter because ‘…who can really say what makes someone a poet or a scientist?’ He goes on to broadly say that a data scientist is ‘…someone with a data driven research agenda, who adheres to or aspires to using a principled implementation of statistical methods and uses efficient computation skills.’
Regardless of who is right, alongside those specific, more-technical, definitions, there is value in having a simple definition, even if we lose a bit of specificity. For instance, probability is often informally defined as ‘counting things’ (McElreath 2020, 10). In a similar informal sense, data science can be defined as something like: ‘humans measuring stuff, typically related to other humans, and using sophisticated averaging to explain and predict’.
That may sound a touch cute, but Francis Edgeworth, the Irish nineteenth century statistician and economist, who went to Trinity College Dublin, considered statistics to be the science ‘of those Means which are presented by social phenomena,’ so it is in good company (Edgeworth 1885).
In any case, one feature of this definition is that it does not treat data as terra nullius, or nobody’s land. Statisticians tend to see data as the result of some process that we can never know, but that we try to use data to come to understand. Many statisticians care deeply about data and measurement, but there are many cases in statistics where data kind of just appear; they belong to no one. But that is never actually the case.
Data must be gathered, cleaned, and prepared, and these decisions matter. Every dataset is sui generis, or a class by itself, and so when you come to know one dataset well, you just know one dataset, not all datasets.
More broadly, I think that much of data science focuses on the ‘science,’ but it is important that we also focus on ‘data.’ And that is another feature of my cutesy definition of data science which I posited before. A lot of data scientists are generalists, who are interested in a broad range of problems. Often, the thing that unites these is the need to gather, clean, and prepare messy data. And often it is the specifics of those data that require the most time, that update most often, and that are worthy of our most full attention. Unfortunately, it’s not typically the type of thing that is professionally rewarded.
What we can learn from a historical Dublin census?
At this point I’d like to look back, for a moment, at the origins of data science. If we look at the history of statistics, we very quickly find ourselves surrounded by Irish contributions.
In preparing for this talk I was thrilled to learn about the book by the Reverend James Whitelaw, and this is its actual title, ‘An essay on the population of Dublin. Being the result of an actual survey taken in 1798, with great care and precision, and arranged in a manner entirely new’ (Whitelaw 1905). I really do think that we all maybe need to adopt a little more of the Whitelaw’s detail in our paper titles!
In any case, Whitelaw (1905) says that he is fed up with the bad estimates of the size of the population in various capitals. And he particularly singled out London, which he says has estimates that range anywhere between 128,570 and 300,000. Instead, he says that he intends to make an accurate count of the number of inhabitants of Dublin.
He describes how:
When I first entered on the business, I conceived that I should have little more to do than to transcribe carefully the list of inhabitants affixed to the door of each house by order of the Lord Mayor.
Like many of us who spend our days in data, he found it was not that simple. Instead, he found:
(t)he lists on the doors… presented generally to view a confused chaos of names, frequently illegible, and generally short of the actual number by a third, or even one-half’. He goes onto say that instead, he and his assistants braved ’the dread of infectious diseases,… filth, stench, and darkness,… to explore… every room of those wretched habitations, from the cellar to the garret, and on the spot ascertained their population.
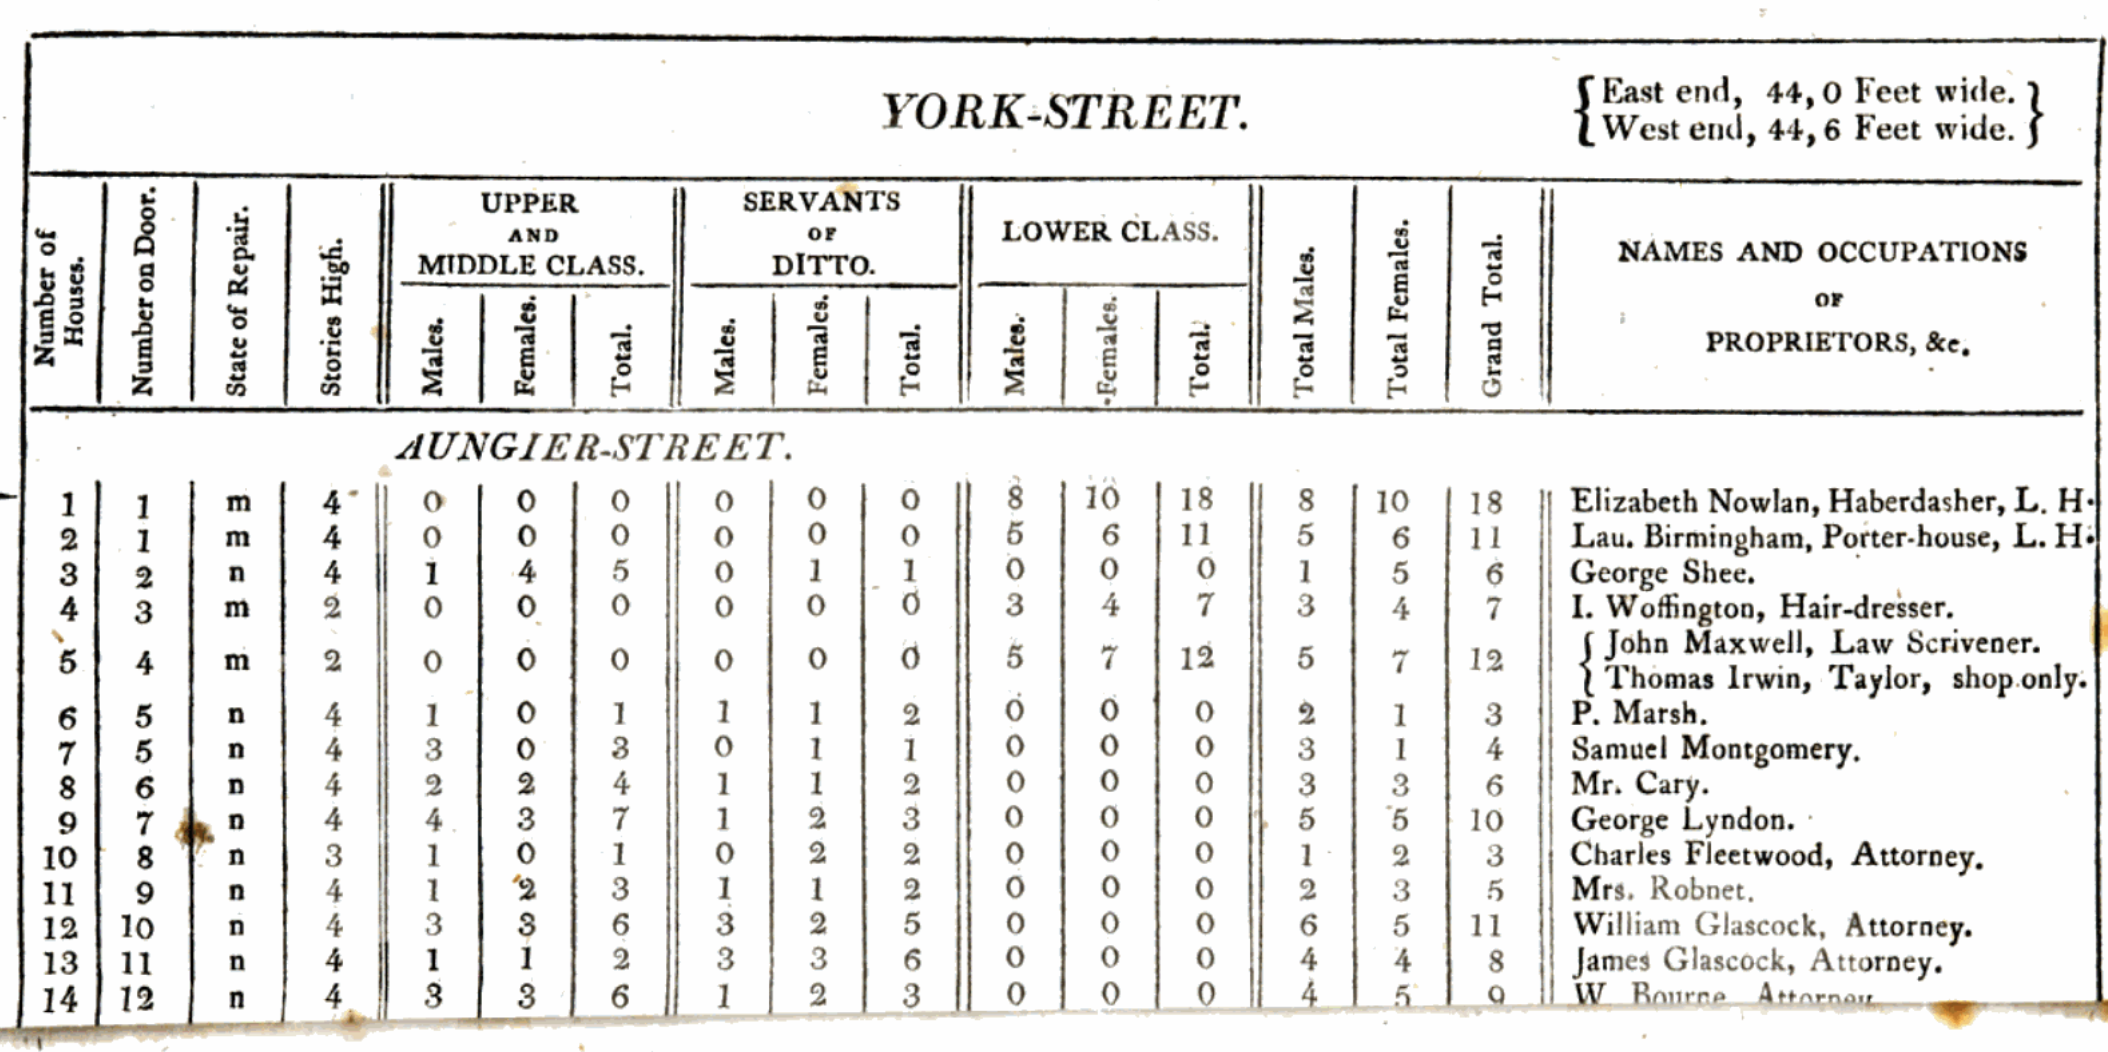
The resulting tables looked something like this (Figure @ref(fig:iceberg)):
And in case you’re interested, his estimate of the total population of Dublin in 1798 was estimated at 182,370.
I was surprised by how confident Whitelaw was in his numbers. My PhD is in economic history, where I was interested in Australian economic history, especially political history. And the thing about economic historians is that we have to create, clean, and prepare our own datasets from whatever traces we can find before we can analyse it. So that training focuses one’s mind on measurement, and sampling.
And there’s an odd phenomenon that I’ve observed where the further one is away from decisions to do with the counting, measurement, organisation, and categorisation, the more one tends to trust the resulting datasets. That is, the person that actually does the hard work of constructing our datasets is usually the one that trusts them the least.
I’ve never understood this confidence that people have in datasets that they don’t construct themselves.
It’s an absolute privilege to get to work in data science. To be able to feel, like Reverend Whitelaw did, that one is bringing some order to things. But it’s important to realise the perspective that one brings as one is doing that.
Now my point here isn’t to attack Whitelaw, as he is long dead and incapable of defending himself, but, I skipped over a bunch of the actual quote in Whitelaw. In particular, after talking about that bit about just looking at the lists on the doors:
As the families of the middle and upper classes always contained some individual who was competent to the task, and as few had any motive to conceal or misrepresent, I found their lists, in general, extremely correct; but among the lower class, which forms the great mass of the population of this city, the case was very different…. This I at first imputed to design, but was afterwards convinced that it proceeded from ignorance and incapacity.
But how could he possibly know?
To a certain extent we are wasting our time. We have a perfect model of the world—it is the world! But it is too complicated. If we knew perfectly how everything was affected by the uncountable factors that influence it, then we could perfectly forecast a coin toss, a dice roll, and every other seemingly random process each time. But we cannot. Instead, we must simplify things to that which is plausibly measurable, and it is that which we define as data. Our data are a simplification of the messy, complex, world from which they were generated.
There are different approximations of ‘plausibly measurable.’ Hence, datasets are always the result of choices. We must decide whether they are nonetheless reasonable for the task at hand. We use statistical models to help us think deeply about, explore, and hopefully come to better understand, our data.
Much of statistics is focused on considering, thoroughly, the data that we have. And that was appropriate for when our data were predominately agricultural, astronomical, or from the physical sciences. But with the rise of data science, mostly because of the value of its application to datasets generated by humans, we must also actively consider what is not in our dataset. Who is systematically missing from our dataset? Whose data does not fit nicely into the approach that we are using and are hence is being inappropriately simplified? If the process of the world becoming data necessarily involves abstraction and simplification, then we need to be clear about the points at which we can reasonably simplify, and those which would be inappropriate, recognising that this will be application specific.
Data science needs diversity. And it’s one reason that I’m excited by all the initiatives to increase participation by women and other underrepresented groups. We need our labs, our classrooms, and of course, eventually, our startups and businesses to be representative of the broader society.
The process of our world becoming data necessarily involves measurement. As I mentioned before, paradoxically, often those that do the measurement and are deeply immersed in the details have less trust in the data than those that are removed from it. Even seemingly clear tasks, such as measuring distance, defining boundaries, and counting populations, are surprisingly difficult in practice. Turning our world into data requires many decisions and imposes much error. Among many other considerations, we need to decide what will be measured, how accurately we will do this, and who will be doing the measurement.
An important example of how something seemingly simple quickly becomes difficult is maternal mortality. That refers to the number of women who die while pregnant, or soon after a termination, from a cause related to the pregnancy or its management (WHO 2019). It is difficult but critical to turn the tragedy of such a death into cause-specific data because that helps mitigate future deaths. Some countries have well-developed civil registration and vital statistics (CRVS). These collect data about every death. But many countries do not have a CRVS and so not every death is recorded. Even if a death is recorded, defining a cause of death may be difficult, especially when there is a lack of qualified medical personal or equipment. Maternal mortality is especially difficult because there are typically many causes. Some CRVS have a checkbox on the form to specify whether the death should be counted as maternal mortality. But even some developed countries have only recently adopted this. For instance, it was only introduced in the US in 2003, and even in 2015 Alabama, California, and West Virginia had not adopted the standard question (MacDorman and Declercq 2018).
On balance between data and science
I mentioned at the start of the talk that I’m appointed in both the Faculty of Information and the Department of Statistical Sciences. For those who don’t know, faculties of information were created around the turn of the century to train librarians. Library science of course has a long and distinguished history of archiving, categorising, storing, and retrieving information, and for a long time when computers were first developed, a lot of the initial work was done by librarians, or at libraries. I suspect there is a gendered aspect to this, with librarians often being female, but a lot of that work was systematically overlooked and was re-invented later. This continues today, with our library at the University of Toronto doing excellent work that is consistently overlooked. I used to feel a bit funny about being jointly appointed, but it turns out that the first chair of the Department of Statistics at Trinity College Dublin, Gordon Foster, was not only a statistician, but he also created the International Book Numbering System (ISBN), which we still use today.
In 1968 Foster gave the Geary Lecture at the Economic and Social Research Institute in Dublin (Foster 1968). And I think it is worth revisiting that talk because he was clearly, yet another, Irish statistician who was well ahead of his time.
Foster (1968) first describes how:
[j]ust prior to the time when my own career in statistics was commencing, an important development took place in which I was therefore able to participate straight away, and which has since had a great effect on the development of the subject. I mean of course the invention of the computer.
It’s funny, but fifty years on, I actually feel the same way about my career!
Foster (1968) goes on to say that
it was something of an achievement to get a programme actually working. It was useful to have handy a screwdriver and scotch-tape, and to know where to kick the machine if it stuck.
And as someone who gets the privilege to write code for living, I do wonder if much has changed!
It’s interesting that Foster (1968) points very clearly to data science in this talk, where he says:
(s)tatistics are concerned with the processing and analysis of masses of data and with the development of mathematical methods of extracting information from data. Combine all this activity with computer methods and you have something more than the sum of its parts.
Talking about computers at the time, Foster (1968) says:
(t)hey are capable of performing any structured task, from planning a hospital diet, retrieving a legal precedent, or controlling stocks in a warehouse, to playing a reasonably good game of chess… I think, we begin to realise that the endeavour which I have referred to as information technology is no longer something just affecting specialists, but is bringing about changes in society affecting us all.
How easy it would be to change ‘information technology’ to ‘data science’ in those quotes for them to ring true almost a lifetime after they were spoken.
We always use various instruments to turn the world into data. For instance, in astronomy, the development of better telescopes, and eventually satellites and probes, enabled new understanding of other worlds. We similarly have new instruments for turning our own world into data being developed each day.
In the social sciences, a census was once a generational-defining event. And it’s appropriate that this talk happens near the Christmas holidays given the role that the census played in that event. But now we have regular surveys, transactions data available by the second, and almost all interactions on the internet become data of some kind. The development of such instruments has enabled exciting new stories to be told with data.
I think for the past ten years or so, we’ve had the balance wrong in data science. There has been too much focus on the ‘science’ bit, without sufficient focus on the ‘data’ bit.
It is not just the ‘science’ bit that is hard, it is the ‘data’ bit as well. I feel that Foster would have known this, and we are just reinventing things. For instance, researchers went back and examined one of the most popular text datasets in computer science, and they found that around 30 per cent of the data were inappropriately duplicated (Bandy and Vincent 2021). There is an entire field—linguistics—that specialises in these types of datasets, and inappropriate use of data is one of the dangers of any one field being hegemonic. The strength of data science is that it brings together folks with a variety of backgrounds and training to the task of learning about some dataset. It is not constrained by what was done in the past. But this means that we must go out of our way to show respect for those who do not come from our own tradition, but who are nonetheless as similarly interested in a dataset, or in a question, as we are.
I’m picking on CS a little here, but my home of the social sciences is just as bad and researchers like me are trying to refocus us on data a little more than we have been in the past.
So what are some examples of things that I work on?
Examples of my work
I mentioned that my PhD is in economic history, but I spent most of my PhD trying to deal with big text datasets. And when I say ‘dealing’ I mean using R to clean and tidy them, which was the work of years. My supervisors—John Tang, Tim Hatton, Martine Mariotti, and Zach Ward—gave me the freedom to do what I wanted, with regular weekly meetings. It’s not a topic that traditionally would have been appropriate in economics, and I’m grateful they gave me the space because traditional economics is not for me, but data science is.
Effect of elections and changed prime ministers
One result of this work was the paper—The Increased Effect of Elections and Changing Prime Ministers on Topics Discussed in the Australian Federal Parliament between 1901 and 2018—(Alexander and Alexander 2021) which was co-authored with my wife Monica. In Australia there is a written record of what is said in parliament called Hansard. We grabbed the text of everything said between 1901 and 2018 and then built a statistical model to look at whether the topics of discussion changed when there was an election or when there was a change in the prime minister. We found that changes in prime minister tend to be associated with topic changes even when the party in power does not change; and the effect of elections has been increasing since the 1980s, regardless of whether the election results in a change of prime minister.
Lesson: Always start small and then iterate.
I came to that paper hopelessly naive and lost. I didn’t know that text analysis, and natural language processing more generally, was something that was incredibly popular. I didn’t have the skills that I needed, and really all I had was an all-consuming interest in the broad area - I didn’t even have a question. The dataset has over a billion words in it. So the main lesson for me was in dealing with big datasets. And here I don’t mean in terms of technical skills, I mean in terms of approach. These days when I have students and they want to use the Hansard or any large dataset, I start by insisting that they just use one month of data. After they analyse and write that up, then they can go to a year, and then they can continue to build up slowly.
The reason that I know now that’s the best way to go is that I somehow convinced myself that I couldn’t possibly answer any interesting questions until I had a century worth of data. And because I was teaching myself everything as I went, it took me more than a year to just get the data into a usable format.
If you take nothing away from this talk, please I beg you take this away: the most important, vital thing, is that you create a minimal viable product of any research. And that minimal viable product needs to be something that you can finish within a week. If you can’t do that then adjust the scope and the question until you can. Then you achieve that MVP and then you start to scale up to the question that you’re interested in, which is hopefully something that can be published.
Explaining Why Text is Sexist or Racist with GPT-3
As anyone who has cared for young children knows, the response to almost any statement can be ‘why?’. One can quickly find oneself trying to explain the finer details of photosynthesis to a 3-year-old, and the extent to which one struggles with this tends to put in sharp relief the extent of one’s knowledge. Large language models such as OpenAI’s GPT-3 can generate text that is indistinguishable from that created by humans. They can also classify whether some given text is sexist or racist (Chiu and Alexander 2021).
In the paper—Explaining Why Text is Sexist or Racist with GPT-3—which was co-authored by Ke-Li Chiu we assess the extent to which GPT-3 can generate explanations for why a given text is sexist or racist. We prompt GPT-3 to generate explanations in a question-and-answer manner: ‘Is the following statement in quotes sexist? Answer yes or no and explain why.’ We then assess the adequacy of the explanations generated by GPT-3. We are interested in firstly, the extent to which it correctly classifies whether the statements are sexist/racist; and secondly, the reasonableness of the explanation that accompanies that classification.
We find that GPT-3 does poorly in the open-ended approach. When we add more structure to guide its responses the model performs better. But even when it correctly classifies racism or sexism, the accompanying explanations are often inaccurate. At times they even contradict the classification. On a technical level, we find a clear relationship between the hyper-parameter temperature and the number of correctly matched attributes, with substantial decreases as temperature increases.
Lesson: Always teach
I just used a bunch of terms there and you probably assume that I know what they mean. In writing the paper that preceded this one, I actually fooled myself into thinking that I knew what they meant. It wasn’t until I tried to teach the material that I realised that I didn’t have a clue what was going on.
A lot of my colleagues try to get out of teaching, and I can understand why they would think that, but I’ve found that having to teach has made me a better researcher. For one reason, I found that it’s too easy to fool yourself into thinking you know something until you have to explain it. And I also kind of think that a lot of us in academia need pressure, constraints, and a weekly structure, in order to do our best work.
Reproducibility of COVID-19 pre-prints
The final paper that I’d like to touch on is—Reproducibility of COVID-19 pre-prints—by Annie Collins and me (Collins and Alexander 2021). In that paper we are interested in the reproducibility of COVID-19 research. We create a dataset of pre-prints posted to arXiv, bioRxiv, medRxiv, and SocArXiv between 28 January 2020 and 30 June 2021 that are related to COVID-19. We extract the text from these pre-prints and parse them looking for keyword markers signalling the availability of the data and code underpinning the pre-print. For the pre-prints that are in our sample, we are unable to find markers of either open data or open code for 75 per cent of those on arXiv, 67 per cent of those on bioRxiv, 79 per cent of those on medRxiv, and 85 per cent of those on SocArXiv. We conclude that there may be value in having authors categorize the degree of openness of their pre-print as part of the pre-print submissions process, and more broadly, there is a need to better integrate open science training into a wide range of fields.
Lesson: You always need the code more than once
I went into that paper thinking that I’d just quickly write some code to download some files and then be done with it. But then Annie wanted to broaden the scope of the paper, so the code needed to be re-written because she couldn’t understand what I’d done. And then we had to re-run the code because we wanted to update everything before she presented the paper. And that meant re-writing things. And then we to re-run the code before we submitted the paper. Again that meant re-writing things.
We eventually just turned the code into an R package, which is on CRAN as heapsofpapers (Alexander and Mahfouz 2021). Which is what I should have done from the start. The lesson that I learnt from this paper is that regardless of how certain you are that you’ll never use some particular code again, you’ll always need it.
Open questions
How do we write unit tests for data science?
One thing that working with real computer scientists has taught me is the importance of unit tests. Basically this just means writing down the small checks that we do in our heads all the time. Like if we have a column that purports to the year, then it’s unlikely that it’s a character, and it’s unlikely that it’s an integer larger than 2500, and it’s unlikely that it’s a negative integer. We know all this, but writing unit tests has us write this all down.
In this case it’s obvious what the unit test looks like. But more generally, we often have little idea what our results should look like if they’re running well. The approach that I’ve taken is to add simulation - so we simulate reasonable results, write unit tests based on that, and then bring the real data to bear and adjust as necessary. But I really think that we need extensive work in this area because the current state-of-the-art is lacking.
What happened to the revolution?
I don’t understand what happened to the promised machine learning revolution in social sciences. Specifically, I’m yet to see any convincing application of machine learning methods that are designed for prediction to a social sciences problem where what we care about is understanding. I would like to either see evidence of them or a definitive thesis about why this can’t happen. The current situation is untenable where folks, especially those in fields that have been historically female, are made to feel inferior even though their results are no worse.
How do we think about power?
As someone who learnt statistics from economists, but now is partly in a statistics department, I do think that everyone should learn statistics from statisticians. This isn’t anything against economists, but the conversations that I have in the statistics department about what statistical methods are and how they should be used are very different to those that I’ve had in other departments.
I think the problem is that people outside statistics, treat statistics as a recipe in which they follow various steps and then out comes a cake. With regard to ‘power’—it turns out that there were a bunch of instructions that no one bothered to check—they turned the oven on to some temperature without checking that it was 180C, and that’s fine because whatever mess came out was accepted because the people evaluating the cake didn’t know that they needed to check the temperature had been appropriately set. (I’m ditching this analogy right now).
As you know, the issue with power is related to the broader discussion about p-values, which basically no one is taught properly, because it would require changing an awful lot about how we teach statistics i.e. moving away from the recipe approach.
And so, my specific issue is that people think that statistics is a recipe to be followed. They think that because that’s how they are trained especially in social sciences like political science and economics, and that’s what is rewarded. But that’s not what these methods are. Instead, statistics is a collection of different instruments that let us look at our data in a certain way. I think that we need a revolution here, not a metaphorical tucking in of one’s shirt.
Thank you
Right. So I think I’ll leave it there. Thank you again to Niamh for inviting me. And I hope that I haven’t bored you all too much.Merry Christmas, happy holidays, and I hope everyone has a wonderful start to 2022.
I’d be happy to take any questions.
Acknowledgments
Thanks very much to Niamh Cahill for the invitation to speak, and to Monica Alexander for her suggestions and comments.
References
Alexander, Rohan, and Monica Alexander. 2021. “The Increased Effect of Elections and Changing Prime Ministers on Topics Discussed in the Australian Federal Parliament Between 1901 and 2018.” https://arxiv.org/abs/2111.09299.
Alexander, Rohan, and A Mahfouz. 2021. Heapsofpapers: Easily Download Heaps of PDF and CSV Files. https://CRAN.R-project.org/package=heapsofpapers.
Bandy, Jack, and Nicholas Vincent. 2021. “Addressing "Documentation Debt" in Machine Learning Research: A Retrospective Datasheet for BookCorpus.” https://arxiv.org/abs/2105.05241.
Benjamin S. Baumer, Daniel T. Kaplan, and Nicholas J. Horton. 2021. Modern Data Science with r. 2nd ed. https://mdsr-book.github.io/mdsr2e/.
Chiu, Ke-Li, and Rohan Alexander. 2021. “Detecting Hate Speech with GPT-3.” https://arxiv.org/abs/2103.12407.
Collins, Annie, and Rohan Alexander. 2021. “Reproducibility of COVID-19 Pre-Prints.” https://arxiv.org/abs/2107.10724.
Craiu, Radu V. 2019. “The Hiring Gambit: In Search of the Twofer Data Scientist.” Harvard Data Science Review 1 (1). https://doi.org/10.1162/99608f92.440445cb.
Edgeworth, Francis Ysidro. 1885. “Methods of Statistics.” Journal of the Statistical Society of London, 181–217.
Foster, Gordon. 1968. “Computers, Statistics and Planning: Systems or Chaos?” Geary Lecture. https://www.esri.ie/system/files/media/file-uploads/2016-03/GLS2.pdf.
Leek, Jeff, and Roger D. Peng. 2020. Advanced Data Science 2020. http://jtleek.com/ads2020/index.html.
MacDorman, Marian F, and Eugene Declercq. 2018. “The Failure of United States Maternal Mortality Reporting and Its Impact on Women’s Lives.” Birth (Berkeley, Calif.) 45 (2): 105.
McElreath, Richard. 2020. Statistical Rethinking: A Bayesian Course with Examples in r and Stan. 2nd ed.
Timbers, Tiffany-Anne, Trevor Campbell, and Melissa Lee. 2021. Data Science: A First Introduction. https://ubc-dsci.github.io/introduction-to-datascience/.
Whitelaw, James. 1905. An Essay on the Population of Dublin. Being the Result of an Actual Survey Taken in 1798, with Great Care and Precision, and Arranged in a Manner Entirely New. Graisberry; Campbell.
WHO. 2019. “Trends in Maternal Mortality 2000 to 2017: Estimates by WHO, UNICEF, UNFPA, World Bank Group and the United Nations Population Division.” https://www.who.int/reproductivehealth/publications/maternal-mortality-2000-2017/en/.
Wickham, Hadley, and Garrett Grolemund. 2016. R for Data Science. O’Reilly. https://r4ds.had.co.nz.